(Troubleshooting) 레디스 사망일기

사건의 발단
사내에서 사용하는 어드민(이하 어드민 A)/외부에서 사용하는 어드민(이하 어드민 B)이 사망하는 사례가 속출하였다.
그 시점은 내가 새롭게 서버를 옮긴 이후부터 발생했다.
내가 서버를 옮긴 것과 이 일이 관련이 없다고 생각했지만,
우선 내가 서버를 옮긴 이후에 발생한 사건이기도 해서 부검을 통해 사인을 밝혀내는 게 우선이었다.
왜 사망했나
1 | org.springframework.dao.QueryTimeoutException: Redis command timed out; nested exception is com.lambdaworks.redis.RedisCommandTimeoutException: Command timed out |
elasticsearch에 저장된 에러 로그를 확인해본 결과 위와 같은 스택 트레이스를 남기고 전사하셨다.
즉, 레디스가 사망해서 레디스를 사용하는 어드민 서버도 사망한 것이었다.
다행인 것은 아예 프로세스 자체가 사망한 게 아니라 Hang에 걸린 상태여서 레디스를 재시작하는 것만으로 사건은 일단락 되었다.
하지만 머지않은 시점에 또 다시 사망하는 사례가 발생하였다.
응급 처치
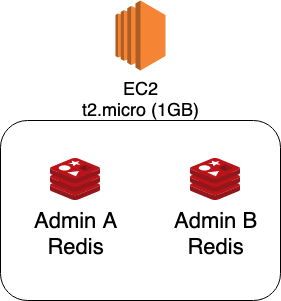
우선 어드민 A가 사용하는 레디스(이하 레디스 A)와 어드민 B가 사용하는 레디스(이하 레디스 B)가 같은 EC2 인스턴스 내에 존재하였다.
또한 메모리 1GB라는 소규모 서버에서 구동하다보니 인메모리 기반의 DB인 레디스에는 굉장히 협소하다고 생각했다.
하지만 우리가 사용하는 건 로그인 세션을 위해서만 사용하지, 그 이외의 것은 사용하지 않고 있어서 여전히 의아하긴 했다.
하지만 문제가 계속해서 발생하다보니 우선은 스케일업을 해야했다.
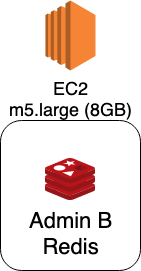
그 중에 레디스 A보다 레디스 B가 더 자주 뻗어서 레디스 B를 새로운 서버로 옮기기로 했다.
트래픽이 그렇게 많지도 않은 어드민 서버의 로그인 세션만 저장하는데
메모리를 8GB씩이나 주는 건 약간 오버하는 경향이 없잖아 보였지만 일단 안정성을 챙기고자 좀 빵빵하게 주었다.
진짜 이유를 찾아서
나는 이미 8GB로 스케일업 했기 때문에 더이상 이런 사건이 발생하지 않을 것으로 예상했지만,
CTO 님께서는 좀 더 정확하게 원인을 분석하자고 하셨다.
나도 대충대충 넘어가다보면 영 찜찜하기도 해서 내 역량도 그닥 올라갈 거 같지 않아서 정확하게 원인을 분석해보는 게 좋을 것 같았다.
이 있기 때문에 이를 이용하기로 했다.")
우선 모니터링하기 위해선 지표(Metric)을 수집해야한다.
그래서 가장 유명한 Redis Exporter를 찾아서 적용해보려고 했다.
해당 Exporter는 Redis의 INFO 커맨드의 출력 결과를 수집해서 /metrics라는 HTTP 엔드포인트로 노출하는 역할을 한다.
그럼 Prometheus에서 일정 주기마다 Pulling 해서 저장하고, 그 데이터를 기반으로 Grafana라는 대시보드를 통해 볼 수 있다.
하지만 해당 Exporter는 Port를 옵션으로 받는 게 아니라 하드코딩 돼있다.
Redis Exporter를 하나만 띄울 거라면 상관 없지만, 우리는 나중에 레디스 A도 업어와야하기 때문에 Redis Exporter를 하나 더 띄워야하는 경우였다.
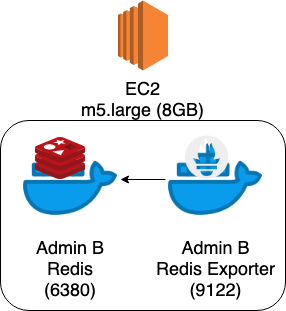
따라서 주객이 전도된 것 같지만 지표 수집을 위해서 기존에 Host OS에 띄워놓은 Redis를 Docker Container로 띄우고,
Redis Exporter도 Docker Container로 띄워서 각 컨테이너끼리 통신하게 끔 하였다.1
2
3
4
5
6
7
8
9
10
11
12
13
14
15
16
17
18# docker-compose.yml
version: '3'
services:
admin-b-redis:
image: redis:5.0.5-alpine
container_name: admin-b-redis
ports:
- 6380:6379
admin-b-redis-exporter:
image: oliver006/redis_exporter:v1.0.0-alpine
container_name: admin-b-redis-exporter
environment:
- REDIS_ADDR=redis://admin-b-redis
- REDIS_EXPORTER_REDIS_ONLY_METRICS=true
ports:
- 9122:9121
restart: on-failure
또한 레디스 B 뿐만 아니라 기존 서버에서 레디스 A도 모니터링을 붙여놓았다.

레디스 A는 우리 사내에서 사용하는 어드민이 사용하는 레디스다.
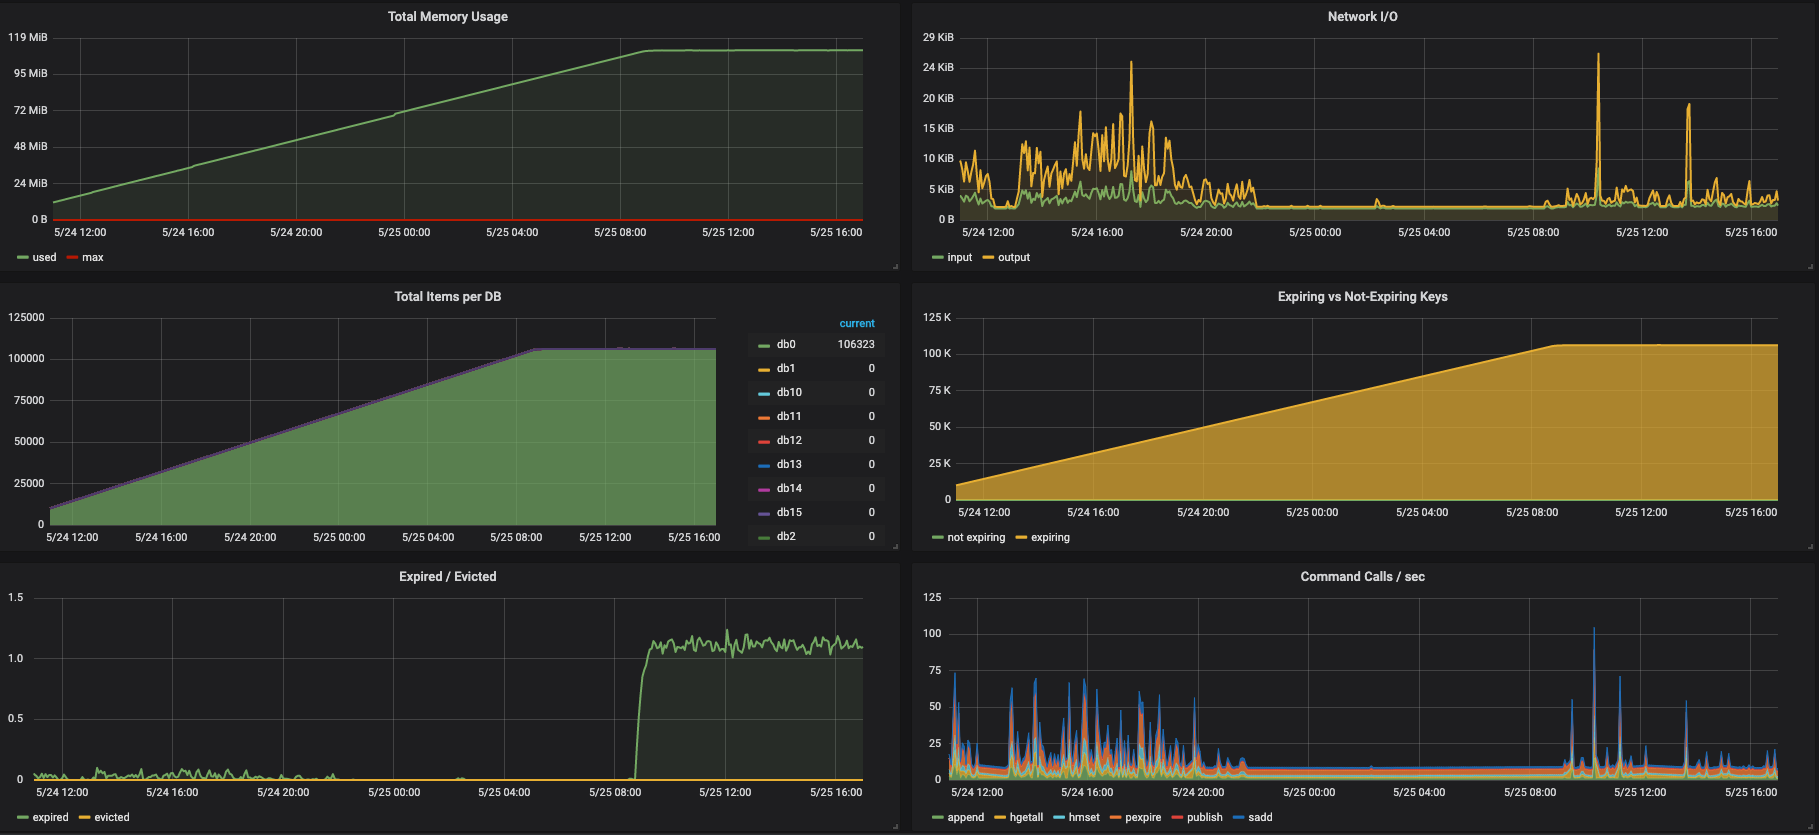
계열사까지 합쳐도 전사 직원이 1,000명도 안 될텐데 생성된 키만 70,000개를 넘었다. (실제로 해당 어드민을 사용하는 유저는 100명도 안 되는데 말이다.)
이는 분명히 이상했지만, 명확하게 이렇게 생성된 원인을 파악할 수 없었다. (못난 나레기 ㅠㅠ…)
우선 스프링 레디스 세션에 설정한 만료기간인 하루가 지나야 뭔가 볼 수 있을 것 같아 날이 밝기를 기다렸다.
그러자 위와 같이 그래프의 양상이 바뀌었다.


여기서 내린 추측은 세션이 만료됨과 동시에 누군가 계속 세션을 생성해서 그래프가 현상유지가 되는 것이라고 전제를 깔고 분석하기 시작했다.
그래서 우선 Nginx의 Access Log부터 까보기로 했다.1
2
3
4
5
6
7
8
9
10
11
12
13
14
15
16
17
18
19
20
21{"@timestamp":"2019-05-24T18:41:32+00:00","remote_addr":"","host":"172.12.1.189","request":"GET /health HTTP/1.1","status": "200","body_bytes_sent":"6","request_time":"0.001","http_referrer":"","http_user_agent":"ELB-HealthChecker/2.0"}
{"@timestamp":"2019-05-24T18:41:34+00:00","remote_addr":"","host":"172.12.1.189:80","request":"GET / HTTP/1.1","status": "302","body_bytes_sent":"0","request_time":"0.010","http_referrer":"","http_user_agent":"Go-http-client/1.1"}
{"@timestamp":"2019-05-24T18:41:34+00:00","remote_addr":"","host":"172.12.1.189","request":"GET /login HTTP/1.1","status": "200","body_bytes_sent":"1769","request_time":"0.012","http_referrer":"http://172.12.1.189:80","http_user_agent":"Go-http-client/1.1"}
{"@timestamp":"2019-05-24T18:41:35+00:00","remote_addr":"","host":"172.12.1.189","request":"GET /health HTTP/1.1","status": "200","body_bytes_sent":"6","request_time":"0.001","http_referrer":"","http_user_agent":"ELB-HealthChecker/2.0"}
{"@timestamp":"2019-05-24T18:41:40+00:00","remote_addr":"","host":"localhost","request":"GET /health HTTP/1.1","status": "200","body_bytes_sent":"6","request_time":"0.001","http_referrer":"","http_user_agent":"Consul Health Check"}
{"@timestamp":"2019-05-24T18:41:44+00:00","remote_addr":"","host":"172.12.1.189:80","request":"GET / HTTP/1.1","status": "302","body_bytes_sent":"0","request_time":"0.010","http_referrer":"","http_user_agent":"Go-http-client/1.1"}
{"@timestamp":"2019-05-24T18:41:44+00:00","remote_addr":"","host":"172.12.1.189","request":"GET /login HTTP/1.1","status": "200","body_bytes_sent":"1769","request_time":"0.012","http_referrer":"http://172.12.1.189:80","http_user_agent":"Go-http-client/1.1"}
{"@timestamp":"2019-05-24T18:41:50+00:00","remote_addr":"","host":"localhost","request":"GET /health HTTP/1.1","status": "200","body_bytes_sent":"6","request_time":"0.001","http_referrer":"","http_user_agent":"Consul Health Check"}
{"@timestamp":"2019-05-24T18:41:54+00:00","remote_addr":"","host":"172.12.1.189:80","request":"GET / HTTP/1.1","status": "302","body_bytes_sent":"0","request_time":"0.010","http_referrer":"","http_user_agent":"Go-http-client/1.1"}
{"@timestamp":"2019-05-24T18:41:54+00:00","remote_addr":"","host":"172.12.1.189","request":"GET /login HTTP/1.1","status": "200","body_bytes_sent":"1769","request_time":"0.012","http_referrer":"http://172.12.1.189:80","http_user_agent":"Go-http-client/1.1"}
{"@timestamp":"2019-05-24T18:42:00+00:00","remote_addr":"","host":"localhost","request":"GET /health HTTP/1.1","status": "200","body_bytes_sent":"6","request_time":"0.001","http_referrer":"","http_user_agent":"Consul Health Check"}
{"@timestamp":"2019-05-24T18:42:02+00:00","remote_addr":"","host":"172.12.1.189","request":"GET /health HTTP/1.1","status": "200","body_bytes_sent":"6","request_time":"0.001","http_referrer":"","http_user_agent":"ELB-HealthChecker/2.0"}
{"@timestamp":"2019-05-24T18:42:04+00:00","remote_addr":"","host":"172.12.1.189:80","request":"GET / HTTP/1.1","status": "302","body_bytes_sent":"0","request_time":"0.010","http_referrer":"","http_user_agent":"Go-http-client/1.1"}
{"@timestamp":"2019-05-24T18:42:04+00:00","remote_addr":"","host":"172.12.1.189","request":"GET /login HTTP/1.1","status": "200","body_bytes_sent":"1769","request_time":"0.012","http_referrer":"http://172.12.1.189:80","http_user_agent":"Go-http-client/1.1"}
{"@timestamp":"2019-05-24T18:42:05+00:00","remote_addr":"","host":"172.12.1.189","request":"GET /health HTTP/1.1","status": "200","body_bytes_sent":"6","request_time":"0.001","http_referrer":"","http_user_agent":"ELB-HealthChecker/2.0"}
{"@timestamp":"2019-05-24T18:42:10+00:00","remote_addr":"","host":"localhost","request":"GET /health HTTP/1.1","status": "200","body_bytes_sent":"6","request_time":"0.001","http_referrer":"","http_user_agent":"Consul Health Check"}
{"@timestamp":"2019-05-24T18:42:14+00:00","remote_addr":"","host":"172.12.1.189:80","request":"GET / HTTP/1.1","status": "302","body_bytes_sent":"0","request_time":"0.010","http_referrer":"","http_user_agent":"Go-http-client/1.1"}
{"@timestamp":"2019-05-24T18:42:14+00:00","remote_addr":"","host":"172.12.1.189","request":"GET /login HTTP/1.1","status": "200","body_bytes_sent":"1769","request_time":"0.012","http_referrer":"http://172.12.1.189:80","http_user_agent":"Go-http-client/1.1"}
{"@timestamp":"2019-05-24T18:42:20+00:00","remote_addr":"","host":"localhost","request":"GET /health HTTP/1.1","status": "200","body_bytes_sent":"6","request_time":"0.001","http_referrer":"","http_user_agent":"Consul Health Check"}
{"@timestamp":"2019-05-24T18:42:24+00:00","remote_addr":"","host":"172.12.1.189:80","request":"GET / HTTP/1.1","status": "302","body_bytes_sent":"0","request_time":"0.010","http_referrer":"","http_user_agent":"Go-http-client/1.1"}
{"@timestamp":"2019-05-24T18:42:24+00:00","remote_addr":"","host":"172.12.1.189","request":"GET /login HTTP/1.1","status": "200","body_bytes_sent":"1769","request_time":"0.012","http_referrer":"http://172.12.1.189:80","http_user_agent":"Go-http-client/1.1"}
ELB와 Consul은 Health Check Endpoint를 제대로 찌르고 있다.
하지만 Go-http-client/1.1라는 Agent는 계속해서 /을 찌르는데 이 때 바로 세션이 생성되는 것이다.
(추후에 /login으로 302 redirect 되지만 실제 세션 생성 시점은 그 이전이다.
비로그인 유저의 세션을 만드는 이유는 해당 세션을 가지고 동시 접속자 체크, 쇼핑몰 등등에서 비회원에게 장바구니 기능 제공 등등의 기능에서 사용이 가능하기 때문이다.
라고 한국 스프링 사용자 모임에 질문한 결과 알게 되었다.)
내부 아이피를 직접 찌르고 있기 때문에 외부 크롤러나 봇에 의한 것이라는 전제는 일단 접어두었다. (AWS 계정이 해킹당했을 거라는 끔찍한 상상은 하지 않았다.)
그리고 한 가지 든 의심이 서버의 헬스 체크를 해서 슬랙으로 알림을 주기 위해 사용한 Blackbox Exporter의 설정에 의해 Prometheus에서 위와 같이 헬스체크를 하는 게 아닐까 의심이 되었다.
그리고 의심은 확신으로 접어들기 시작했다.
곧장 Prometheus에서 헬스 체크 엔드포인트를 어떻게 불러오는지 확인을 해보았다.1
2
3global:
scrape_interval: 10s
evaluation_interval: 1s
내가 수집 주기를 scrape_interval: 10s로 설정해놨고, 아래는 172.12.1.189:80을 찌른 로그만 추려본 것이다.1
2
3
4
5
6
7
8
9
10
11
12{"@timestamp":"2019-05-24T18:41:34+00:00","remote_addr":"","host":"172.12.1.189:80","request":"GET / HTTP/1.1","status": "302","body_bytes_sent":"0","request_time":"0.010","http_referrer":"","http_user_agent":"Go-http-client/1.1"}
{"@timestamp":"2019-05-24T18:41:34+00:00","remote_addr":"","host":"172.12.1.189","request":"GET /login HTTP/1.1","status": "200","body_bytes_sent":"1769","request_time":"0.012","http_referrer":"http://172.12.1.189:80","http_user_agent":"Go-http-client/1.1"}
{"@timestamp":"2019-05-24T18:41:44+00:00","remote_addr":"","host":"172.12.1.189:80","request":"GET / HTTP/1.1","status": "302","body_bytes_sent":"0","request_time":"0.010","http_referrer":"","http_user_agent":"Go-http-client/1.1"}
{"@timestamp":"2019-05-24T18:41:44+00:00","remote_addr":"","host":"172.12.1.189","request":"GET /login HTTP/1.1","status": "200","body_bytes_sent":"1769","request_time":"0.012","http_referrer":"http://172.12.1.189:80","http_user_agent":"Go-http-client/1.1"}
{"@timestamp":"2019-05-24T18:41:54+00:00","remote_addr":"","host":"172.12.1.189:80","request":"GET / HTTP/1.1","status": "302","body_bytes_sent":"0","request_time":"0.010","http_referrer":"","http_user_agent":"Go-http-client/1.1"}
{"@timestamp":"2019-05-24T18:41:54+00:00","remote_addr":"","host":"172.12.1.189","request":"GET /login HTTP/1.1","status": "200","body_bytes_sent":"1769","request_time":"0.012","http_referrer":"http://172.12.1.189:80","http_user_agent":"Go-http-client/1.1"}
{"@timestamp":"2019-05-24T18:42:04+00:00","remote_addr":"","host":"172.12.1.189:80","request":"GET / HTTP/1.1","status": "302","body_bytes_sent":"0","request_time":"0.010","http_referrer":"","http_user_agent":"Go-http-client/1.1"}
{"@timestamp":"2019-05-24T18:42:04+00:00","remote_addr":"","host":"172.12.1.189","request":"GET /login HTTP/1.1","status": "200","body_bytes_sent":"1769","request_time":"0.012","http_referrer":"http://172.12.1.189:80","http_user_agent":"Go-http-client/1.1"}
{"@timestamp":"2019-05-24T18:42:14+00:00","remote_addr":"","host":"172.12.1.189:80","request":"GET / HTTP/1.1","status": "302","body_bytes_sent":"0","request_time":"0.010","http_referrer":"","http_user_agent":"Go-http-client/1.1"}
{"@timestamp":"2019-05-24T18:42:14+00:00","remote_addr":"","host":"172.12.1.189","request":"GET /login HTTP/1.1","status": "200","body_bytes_sent":"1769","request_time":"0.012","http_referrer":"http://172.12.1.189:80","http_user_agent":"Go-http-client/1.1"}
{"@timestamp":"2019-05-24T18:42:24+00:00","remote_addr":"","host":"172.12.1.189:80","request":"GET / HTTP/1.1","status": "302","body_bytes_sent":"0","request_time":"0.010","http_referrer":"","http_user_agent":"Go-http-client/1.1"}
{"@timestamp":"2019-05-24T18:42:24+00:00","remote_addr":"","host":"172.12.1.189","request":"GET /login HTTP/1.1","status": "200","body_bytes_sent":"1769","request_time":"0.012","http_referrer":"http://172.12.1.189:80","http_user_agent":"Go-http-client/1.1"}
정확히 10초 주기로 172.12.1.189:80을 찔렀고, 점점 강한 확신으로 변해가고 있다.
Prometheus에서 Blackbox Exporter와 관련된 설정을 또 살펴보자.1
2
3
4
5
6
7
8
9
10
11
12
13
14
15
16
17scrape_configs:
- job_name: 'blackbox_exporter_http'
metrics_path: /probe
params:
module: [http_2xx]
consul_sd_configs:
- server: 'http://consul-server-001.dns:8500'
- server: 'http://consul-server-002.dns:8500'
- server: 'http://consul-server-003.dns:8500'
relabel_configs:
- source_labels: [__meta_consul_tags]
regex: .*,blackbox_exporter_http,.*
action: keep
- source_labels: [__address__]
target_label: __param_target # 여기가 중요
- target_label: '__address__'
replacement: 'blackbox-exporter:9115'
유동적으로 늘어나고 줄어드는 인스턴스에 대비하기 위해 consul을 사용하였다.
우선 consul에 등록된 태그 중에 blackbox_exporter_http란 값을 가지고 있는 서비스를 골라내고__address__ 레이블에 설정된 값(ip:port)을 그대로 __param_target에 설정되는 것에서부터 문제가 시작됐다.
prometheus는 __param_target에 설정된 값을 토대로 헬스체크 한다는 것을 테스트를 통해 밝혔다.
이제는 완전한 확신을 했다.
우선 consul client가 설치된 어드민 A서버로 가서 consul에 어떤 service들을 등록하게 했는지 설정부터 살펴보았다.1
2
3
4
5
6
7
8
9
10
11
12
13
14
15
16
17
18
19
20
21
22
23
24
25
26
27
28
29
30
31
32
33
34
35
36
37
38
39
40
41
42
43
44
45
46{
"services": [
{
"id": "Nginx",
"name": "b2b-admin",
"tags": ["blackbox_exporter_http"],
"port": 80,
"check": {
"id": "Nginx Health Check",
"name": "Nginx Status",
"http": "http://localhost/health",
"method": "GET",
"interval": "10s",
"timeout": "1s"
}
},
{
"id": "Server:8080",
"name": "b2b-admin",
"tags": ["blackbox_exporter_http"],
"port": 8080,
"check": {
"id": "Server:8080 Health Check",
"name": "Server:8080 Status",
"http": "http://localhost:8080/health",
"method": "GET",
"interval": "10s",
"timeout": "1s"
}
},
{
"id": "Server:8081",
"name": "b2b-admin",
"tags": ["blackbox_exporter_http"],
"port": 8081,
"check": {
"id": "Server:8081 Health Check",
"name": "Server:8081 Status",
"http": "http://localhost:8081/health",
"method": "GET",
"interval": "10s",
"timeout": "1s"
}
}
]
}
또한 이제 보니 Nginx 말고 8080 및 8081 포트까지 찌르게 되어있었다.
(우리는 내부적으로 빠른 롤백을 위해 한 서버 인스턴스에 두 개의 어플리케이션 서버를 띄운 후 Nginx Upstream Server를 바꾸는 Blue/Green Deployment 전략을 사용 중이다.)
8080/8081 포트는 Nginx를 타지 않고 직접 프라이빗 IP를 찌르기 때문에 Access Log에 남지는 않았지만 세션도 생성됐을거라고 추측된다.
우선 Prometheus에게 health check endpoint를 넘길 수 있게 끔 수정해야된다.1
2
3
4
5
6
7
8
9
10
11
12
13
14
15
16
17
18
19
20
21
22
23
24
25
26
27
28
29
30
31
32
33
34{
"services": [
{
"id": "Nginx",
"name": "b2b-admin",
"tags": ["blackbox_exporter_http"],
"port": 80,
"meta": {
"health_check_endpoint": "health"
},
...
},
{
"id": "Server:8080",
"name": "b2b-admin",
"tags": ["blackbox_exporter_http"],
"port": 8080,
"meta": {
"health_check_endpoint": "health"
},
...
},
{
"id": "Server:8081",
"name": "b2b-admin",
"tags": ["blackbox_exporter_http"],
"port": 8081,
"meta": {
"health_check_endpoint": "health"
},
...
}
]
}
meta.health_check_endpoint를 사용하게 끔 Prometheus 설정 파일도 바꿔주자.1
2
3
4
5
6
7
8
9
10
11
12
13
14
15
16
17
18
19scrape_configs:
- job_name: 'blackbox_exporter_http'
metrics_path: /probe
params:
module: [http_2xx]
consul_sd_configs:
- server: 'http://consul-server-001.dns:8500'
- server: 'http://consul-server-002.dns:8500'
- server: 'http://consul-server-003.dns:8500'
relabel_configs:
- source_labels: [__meta_consul_tags]
regex: .*,blackbox_exporter_http,.*
action: keep
- source_labels: [__address__, __meta_consul_service_metadata_health_check_endpoint]
target_label: __param_target
regex: '(.*)(\/*);(.*)'
replacement: '$1/$3'
- target_label: '__address__'
replacement: 'blackbox-exporter:9115'
위와 같이 이제 설정을 바꾼 후 다시 Nginx의 Access log를 뒤져보았다.1
2
3
4
5
6
7
8
9
10
11
12{"@timestamp":"2019-05-26T13:57:52+00:00","remote_addr":"","host":"localhost","request":"GET /health HTTP/1.1","status": "200","body_bytes_sent":"6","request_time":"0.001","http_referrer":"","http_user_agent":"Consul Health Check"}
{"@timestamp":"2019-05-26T13:57:54+00:00","remote_addr":"","host":"172.12.1.189:80","request":"GET /health HTTP/1.1","status": "200","body_bytes_sent":"207","request_time":"0.004","http_referrer":"","http_user_agent":"Go-http-client/1.1"}
{"@timestamp":"2019-05-26T13:58:02+00:00","remote_addr":"","host":"localhost","request":"GET /health HTTP/1.1","status": "200","body_bytes_sent":"6","request_time":"0.000","http_referrer":"","http_user_agent":"Consul Health Check"}
{"@timestamp":"2019-05-26T13:58:04+00:00","remote_addr":"","host":"172.12.1.189:80","request":"GET /health HTTP/1.1","status": "200","body_bytes_sent":"207","request_time":"0.004","http_referrer":"","http_user_agent":"Go-http-client/1.1"}
{"@timestamp":"2019-05-26T13:58:12+00:00","remote_addr":"","host":"localhost","request":"GET /health HTTP/1.1","status": "200","body_bytes_sent":"6","request_time":"0.001","http_referrer":"","http_user_agent":"Consul Health Check"}
{"@timestamp":"2019-05-26T13:58:14+00:00","remote_addr":"","host":"172.12.1.189:80","request":"GET /health HTTP/1.1","status": "200","body_bytes_sent":"207","request_time":"0.004","http_referrer":"","http_user_agent":"Go-http-client/1.1"}
{"@timestamp":"2019-05-26T13:58:15+00:00","remote_addr":"","host":"172.12.1.189","request":"GET /health HTTP/1.1","status": "200","body_bytes_sent":"207","request_time":"0.001","http_referrer":"","http_user_agent":"ELB-HealthChecker/2.0"}
{"@timestamp":"2019-05-26T13:58:19+00:00","remote_addr":"","host":"172.12.1.189","request":"GET /health HTTP/1.1","status": "200","body_bytes_sent":"207","request_time":"0.005","http_referrer":"","http_user_agent":"ELB-HealthChecker/2.0"}
{"@timestamp":"2019-05-26T13:58:22+00:00","remote_addr":"","host":"localhost","request":"GET /health HTTP/1.1","status": "200","body_bytes_sent":"6","request_time":"0.001","http_referrer":"","http_user_agent":"Consul Health Check"}
{"@timestamp":"2019-05-26T13:58:24+00:00","remote_addr":"","host":"172.12.1.189:80","request":"GET /health HTTP/1.1","status": "200","body_bytes_sent":"207","request_time":"0.003","http_referrer":"","http_user_agent":"Go-http-client/1.1"}
{"@timestamp":"2019-05-26T13:58:32+00:00","remote_addr":"","host":"localhost","request":"GET /health HTTP/1.1","status": "200","body_bytes_sent":"6","request_time":"0.001","http_referrer":"","http_user_agent":"Consul Health Check"}
{"@timestamp":"2019-05-26T13:58:34+00:00","remote_addr":"","host":"172.12.1.189:80","request":"GET /health HTTP/1.1","status": "200","body_bytes_sent":"207","request_time":"0.003","http_referrer":"","http_user_agent":"Go-http-client/1.1"}
이제 Go-http-client/1.1라는 Agent도 /health을 찌르기 시작했다.
그 이후에 이제 레디스 A를 모니터링 해봤다.

진짜 진짜로 죽은 이유
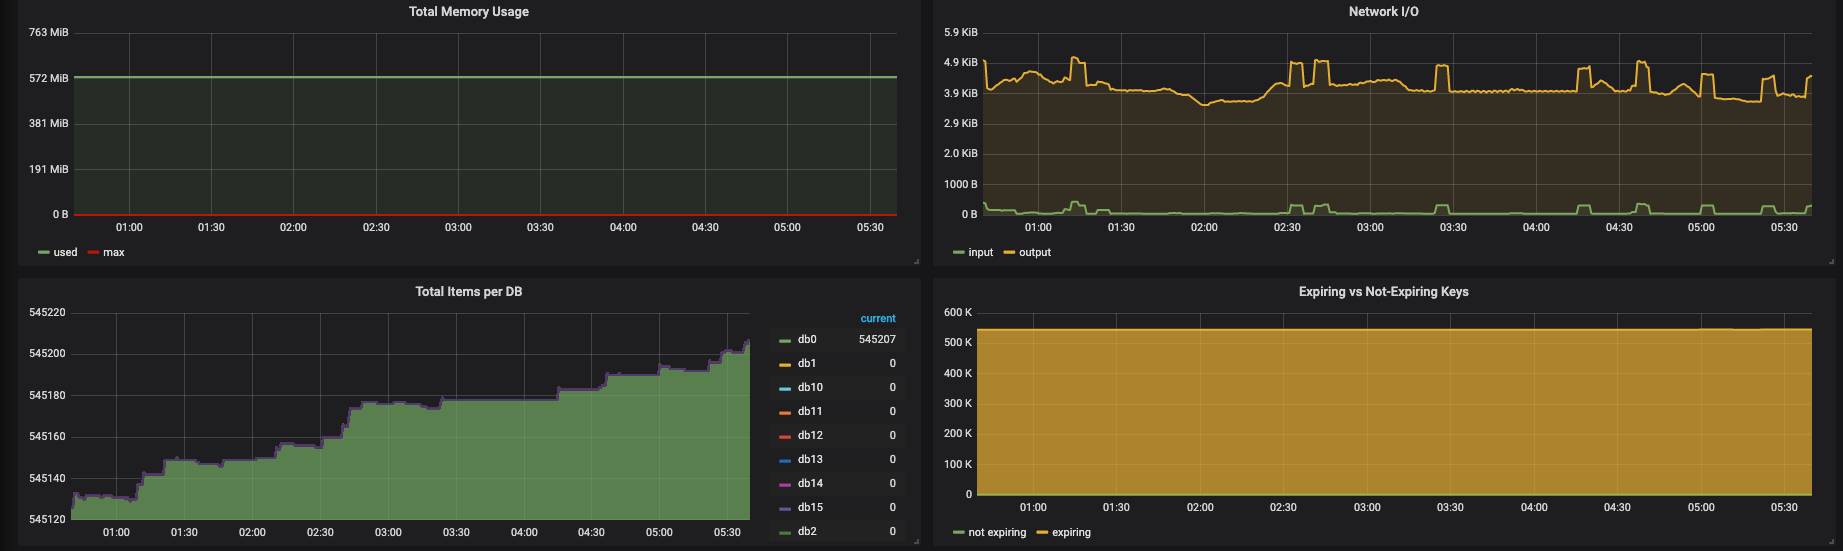
레디스 A와 같이 그래프가 현상유지만 됐으면 별 문제가 되지 않는다.
램은 1GB이지만, 실제로 사용량은 100MB도 되지 않았으므로 전혀 문제될 게 없다.
문제는 레디스 A가 아닌 레디스 B였다.
레디스 B는 어드민 B(외부에서 사용하는 어드민)이 사용하는 레디스이다.
해당 프로젝트는 세션의 만료기간을 Integer.MAX_VALUE(2³¹ − 1 = 2,147,483,647)로 잡아놓았다.
나는 해당 프로젝트의 개발에 참여하지 않아 잘 모르겠는데 아마 외부에서 사용하는 사람들이라면 매번 로그인하는 걸 번거롭게 생각해서 직접 요구사항이 들어오지 않았을까 싶다.

거의 평생동안 쓰레기 세션이 만들어진 채로 계속 유지가 된 거다.

1GB 장비에서 500mb가 넘는 메모리는 엄청난 장애를 동반할 수 있다.
계속 유지되다가 버티지 못하고 레디스가 뻗고, 해당 레디스를 사용하는 서버도 뻗고, 다른 레디스 및 서버에도 영향을 미친 것으로 보인다.
헬스 체크 엔드포인트를 변경한 이후에는 새로운 세션은 거의 만들어지지 않고 계속 현상 유지만 된 것이다.
500MB가 넘는 쓰레기 세션을 68년이 넘는 시간동안이나 끌고 가야하는 문제에 직면하게 되었다.
일단 로그인이 풀리겠지만 쓰레기 세션이 너무 많은 관계로 한 번 털고 가고(레디스 재시작), 세션의 만료기간도 좀 줄이기로 하였다.
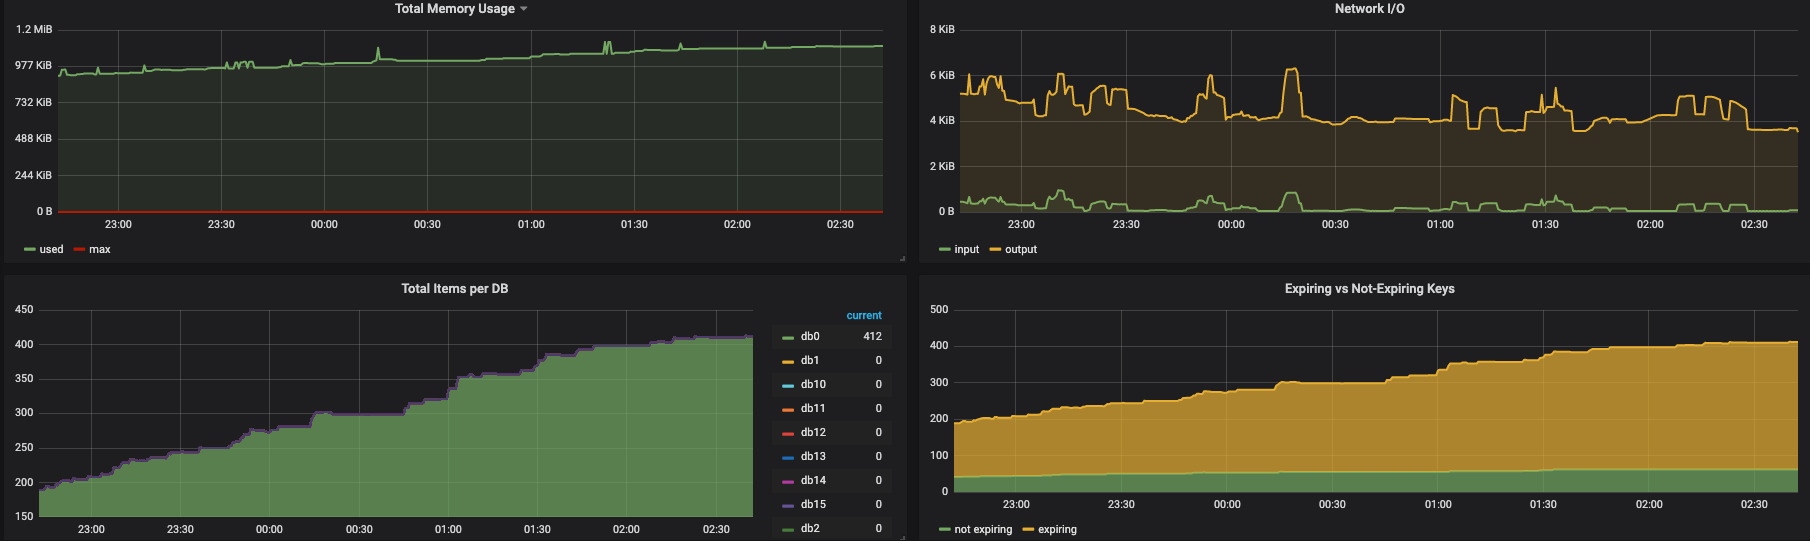
쓰레기 세션을 한 번 털고 나니 메모리 사용량이 확 줄어들었다.
이후 상황
100MB를 치던 키가 쭉쭉 떨어지는 걸 볼 수 있다.")
재밌는 건 중간에 줄어들다가 현상유지되는 구간이다.
이 구간은 내 실수로 두 대의 서버가 떠있는데 한 대의 서버의 헬스 체크 엔드포인트만 수정하고, 나머지 한대는 제대로 수정하지 않아서 현상 유지가 되었다.
(Consul 클라이언트 프로세스를 죽이고 다시 띄웠는데도 Consul 서버에서는 해당 노드와 서비스들이 좀비처럼 살아있었다 ㅠㅠ…)

의 경우에는 너무 쓰레기 세션이 많아서 한 번 털고 갔다.")

솔직히 말해서 스케일 아웃은 괜히했고, 애초에 로그인 세션만 사용하는데 비정상적으로 키가 많이 생성되고 용량 차지를 많이하는 것부터가 이상했다.
다음부터는 좀 더 조심히 일하고 현상 파악을 해야겠다.